Streamlining Strategic Communication with 50 Strategy Glyph Icons
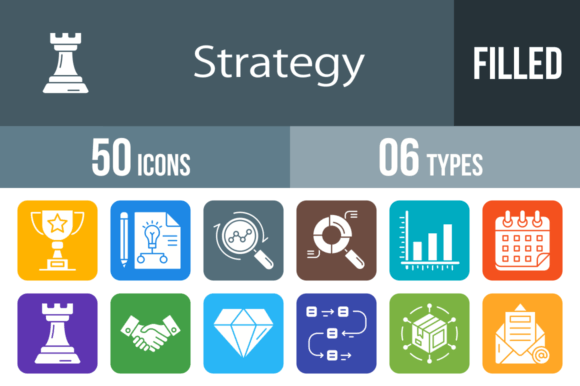
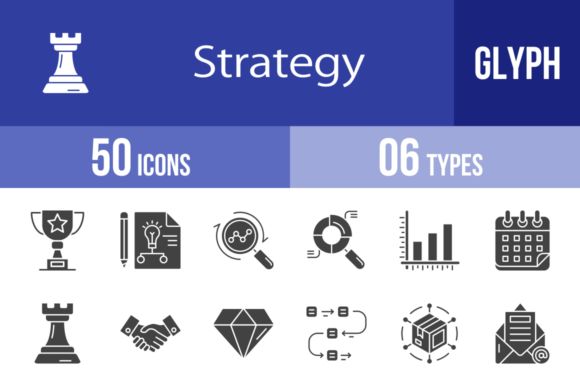
In the fast-paced world of business and digital design, the ability to communicate complex ideas quickly and effectively is a significant competitive advantage. Visual language transcends barriers, allowing professionals to convey strategy, growth, and objectives without relying solely on dense text. This is where a robust visual toolkit becomes indispensable. The 50 Strategy Glyph Icons collection is designed specifically to bridge the gap between abstract business concepts and clear, immediate understanding. Whether you are a project manager outlining a roadmap, a developer creating a dashboard, or a presenter pitching to stakeholders, having the right iconography can transform the clarity of your message.
The Challenge of Visualizing Business Strategy
One of the most common hurdles in corporate environments is the "communication gap." Stakeholders often struggle to grasp intricate workflows, data analytics, or long-term visions when presented with walls of text or cluttered spreadsheets. The human brain processes visual information significantly faster than text, yet finding icons that accurately represent specific strategic concepts—like a "SWOT analysis," "Milestone tracking," or "Pyramids of Needs"—can be difficult. Generic icon sets often lack the nuance required for high-level business discussions, leading to visual metaphors that feel disjointed or confusing.
Furthermore, design consistency is a frequent pain point. When a team uses icons sourced from different places, the result is often a mishmash of styles, line weights, and color palettes that looks unprofessional. This inconsistency can dilute the brand's image and distract the audience from the core message. The 50 Strategy Glyph Icons set addresses these issues by providing a cohesive, unified visual language designed specifically for the corporate and strategic landscape.
How 50 Strategy Glyph Icons Enhances Usability
The primary strength of the 50 Strategy Glyph Icons lies in its versatility and adherence to the unigrid system. This design principle ensures that every icon occupies the same visual weight and space, creating a harmonious layout regardless of how they are arranged. This is particularly crucial for mobile apps and websites, where screen real estate is limited and visual balance is paramount.
For users seeking practical solutions, this collection offers immediate utility. It eliminates the need for custom illustration for every new project. Instead, designers and managers can instantly access high-quality vector graphics representing key concepts such as Analytics, Growth, Revenue, and Selection. Because the icons are provided in six different formats—AI, CDR, EPS, JPG, PNG, and SVG—they are ready to use in virtually any software environment, from Adobe Illustrator to Microsoft PowerPoint, and from web code to print media.
Practical Applications and User Scenarios
The utility of the 50 Strategy Glyph Icons extends across various professional roles and industries. Understanding how different users can implement these assets helps illustrate their value:
- For UX/UI Designers: When building a mobile app or a SaaS dashboard, designers need icons that convey function without text labels. Icons like Workflow, Selection, and Bar Chart help users navigate interfaces intuitively. The vector nature of these files ensures they scale perfectly on high-resolution retina displays without pixelation.
- For Marketing and Sales Teams: Creating pitch decks and sales reports requires visual flair to maintain engagement. Instead of using stock photography, teams can use glyphs like Rocket Launch, Target, and Sale to emphasize key performance indicators. The Megaphone or Rupor icon is perfect for highlighting new campaign launches or announcements.
- For Educators and Consultants: When explaining frameworks like the SWOT analysis or the Pyramids of Needs, visual aids are essential. These icons serve as excellent teaching tools, helping students and clients visualize hierarchical structures and strategic planning models.
Key Features Driving Efficiency
Efficiency is about removing friction from the creative process. The 50 Strategy Glyph Icons are designed with maximum usability in mind. Here is how the specific features translate into tangible benefits:
- Scalability and Editability: Because the set contains 100 vector icons (50 concepts in two variations), they can be resized to fit a tiny mobile tab or a massive billboard without losing quality. Furthermore, the vector paths are easy to edit, allowing users to change colors, stroke weights, or shapes to match specific brand guidelines.
- Cross-Platform Compatibility: The inclusion of SVG and PNG formats ensures web readiness, while AI and EPS files cater to print professionals. This means a marketing team can use the same icon for a website banner (PNG/SVG) and a printed brochure (EPS/AI) without compromising quality.
- Comprehensive Concept Coverage: The collection covers a wide semantic range. From the granular details of a Contract or Email to the broad strokes of Vision, Mission, and Objective, the set ensures that professionals rarely have to look elsewhere for visual assets.
Implementing the Icons for Maximum Impact
To get the most out of the 50 Strategy Glyph Icons, consider the context of your project. If you are designing a data-heavy interface, focus on the analytical glyphs such as Pie Chart, Line Graph, and Statistics. These help users process data faster by providing visual anchors.
For project management presentations, utilizing the timeline-oriented icons like Calendar, Timer, and Milestone can help structure a narrative flow. Pairing the Ladder or Chess piece icon with text about overcoming challenges or strategic thinking adds a layer of sophistication to your storytelling.
Another useful consideration is the psychological impact of the icons. The Trophy and Victory icons can be used in gamified systems or reward notifications within apps to boost user engagement. Conversely, the Red Flag icon serves as a universal warning symbol, useful for error states or risk management sections in reports.
Tailoring the Set to Different Needs
Different industries may interpret these icons differently. For a tech startup, the Startup and Idea icons might represent the company's origin story, while a financial institution might use the Diamond and Revenue icons to represent value and wealth management. The ambiguity of some icons, such as the Maze, allows for creative interpretation—representing either a complex problem to solve or the navigation of a user journey.
Ultimately, the 50 Strategy Glyph Icons set is more than just a collection of graphics; it is a communication toolkit. By standardizing the visual representation of strategic concepts, it helps teams align, accelerates the design process, and ensures that the final output—whether a mobile app, a website, or a printed report—is polished, professional, and easy to understand.